
Demand insights summarizes interactions that ended without a recorded conversion. It shows their count, a revenue estimate, and other metrics that need careful interpretation. On its own, it does not identify requests for a specific product, stock shortages, or confirmed lost sales.
Open it from the Demand insights card under Business Performance on the Dashboard.
What Unfulfilled means
Although the card is labeled Unfulfilled, the report counts interactions that ended in the selected period, were resolved by AI or a teammate or closed by an automation, and have no recorded conversion. One person can have multiple interactions.
This figure does not represent conversations still open in Inbox. The report does not distinguish whether a closed interaction was a support question or a request for an out-of-stock product. It also does not prove that someone intended to buy: the calculation does not require a product, an unavailability reason, or inventory data.
How this report counts results
The selected period uses the interaction end date, not its start date. For example, an interaction that started April 7 and ended April 9 belongs to a period that includes April 9. If a conversion is recorded for that interaction later, it may stop counting as Unfulfilled when the report updates.
This calculation has no demand-recovery window. When comparing periods, use the same timezone and remember that later status and conversion updates can change the figures.
Read the main metrics
Select a metric to update the timeline and the breakdowns shown by the report.
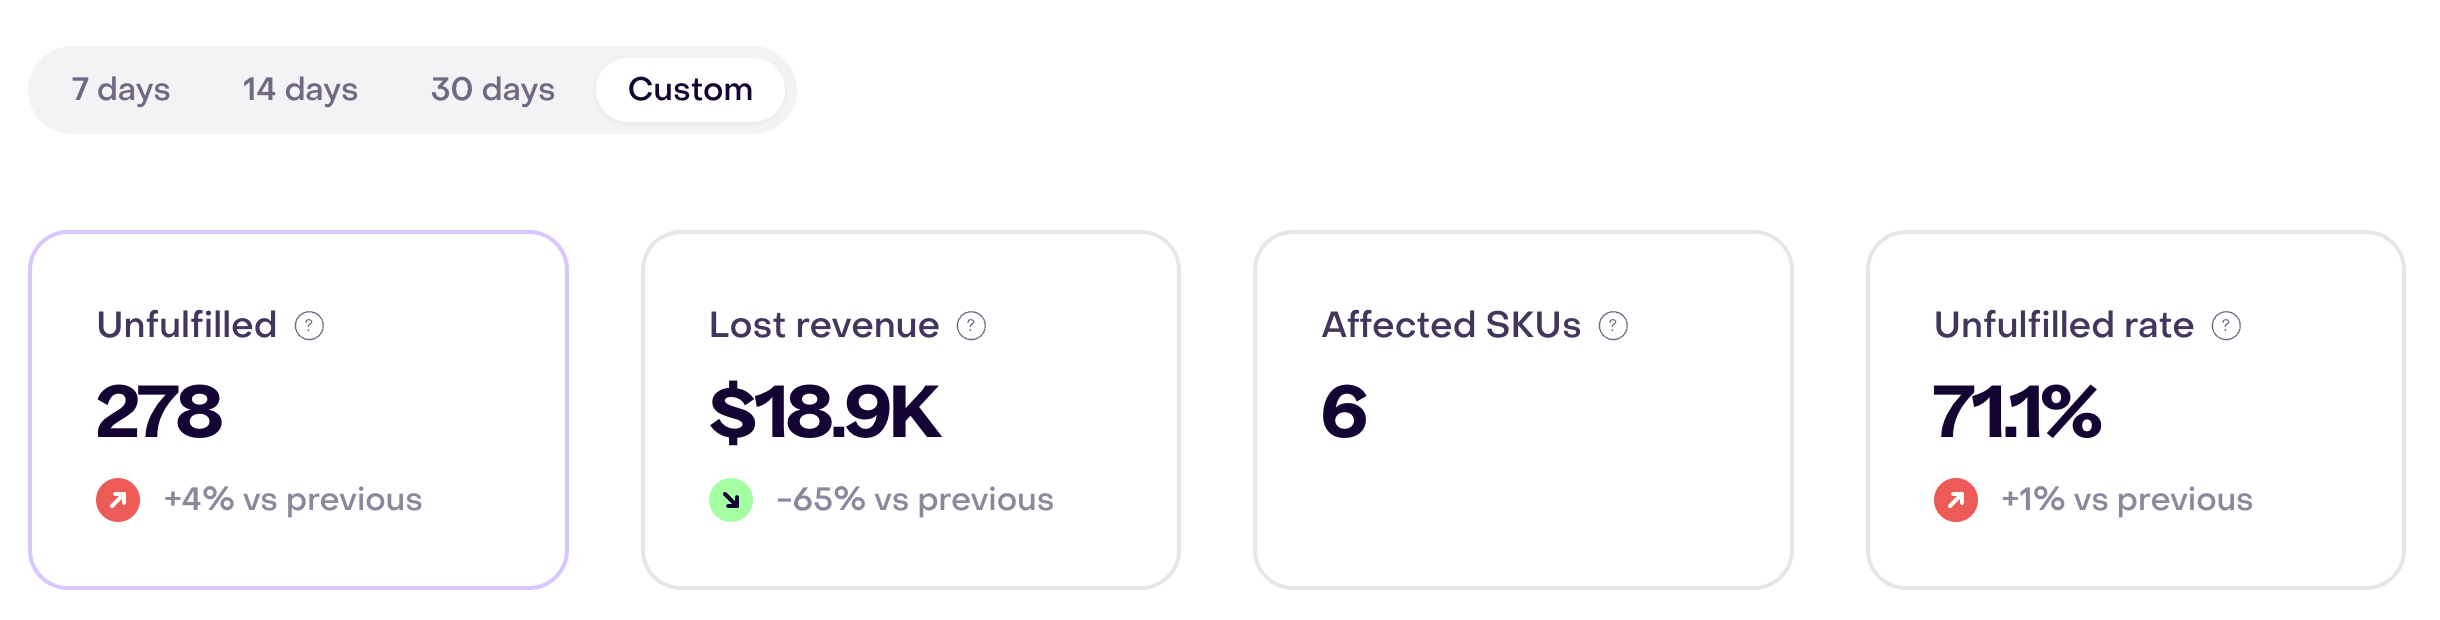
In this demonstration example, the custom period shows all four cards, with Unfulfilled selected.
Unfulfilled
The number of ended interactions that meet the conditions above and have no recorded conversion. It counts interactions, not unique customers or product requests.
Lost revenue
An estimate calculated by multiplying the Unfulfilled count by the average positive tracked revenue amount in the selected period. If there is no positive revenue from which to calculate that average, the report uses a fixed fallback value.
It does not use the price of a product someone asked about. It is not confirmed lost sales, revenue attributed to those interactions, or a prediction of what each customer would have bought. Review the interaction count and average revenue before interpreting a change in this figure.
Affected SKUs
Although the card is labeled Affected SKUs, the current calculation counts distinct recommending Playbooks associated with Unfulfilled interactions. It does not count unique products, variants, or SKUs.
Do not use this figure to decide how many products need restocking. To investigate availability, review catalog data and related conversations separately.
Unfulfilled rate
The Unfulfilled count divided by all interactions that ended in the selected period, expressed as a percentage. The denominator is not limited to product questions or Inbox conversations.
Read the rate alongside the count: it can rise because Unfulfilled interactions increased or because the total number of ended interactions fell.
Use the breakdowns
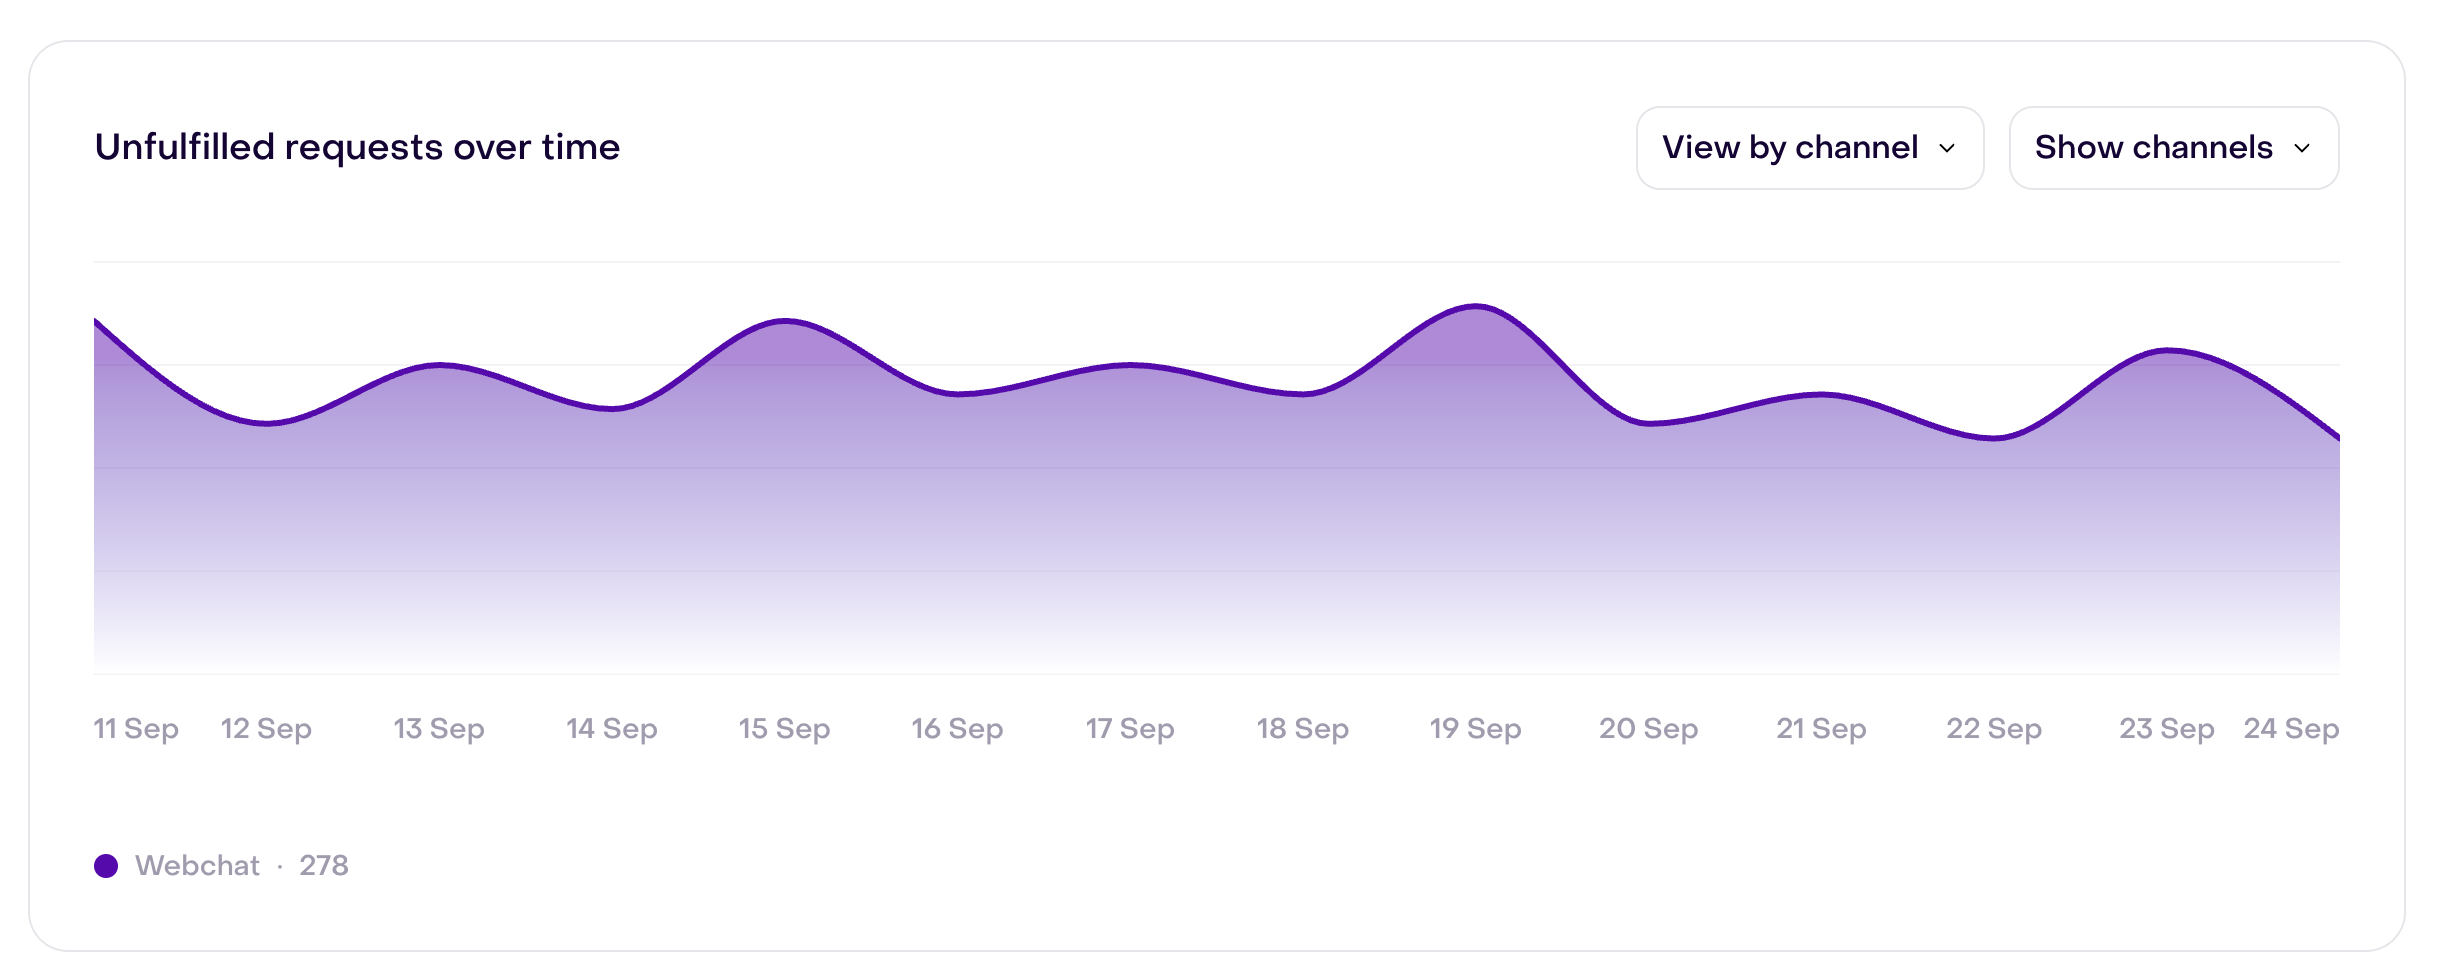
The menu offers options according to the selected metric, but a visible option does not guarantee a calculation behind it. The channel breakdown can help compare Unfulfilled counts and their Lost revenue estimates. Compare any series with its headline metric before using it: some series show counts even when the card is presented as a rate or another unit.
The demonstration capture shows View by channel with one Webchat series: its 278 interactions match the Unfulfilled card for the same period. When more channels have data, inspect each series before comparing them.
The AI versus human comparison groups interactions by start date, while the headline metrics use end date. Its figures therefore may not reconcile with the period total. Use it only as a clue for investigating specific records, not as an exact split of the headline result.
To investigate a change:
- Select the same metric and timezone for the periods you compare.
- Review the Unfulfilled count alongside Unfulfilled rate and the total number of ended interactions.
- If channel data is available, identify where the count changed and check a few source interactions before taking action.
What the breakdowns do not show
The menu may also offer reason, category, product, variant, store, region, intent, or commerce context. The current calculation does not produce results for these dimensions. An empty breakdown does not mean there was no activity or that the reason or product has a value of zero.
If you need to know which product was unavailable, which size someone requested, or where it happened, inspect catalog, inventory, and relevant conversation records in their source systems. This report does not provide those answers.
Compare Demand insights with other reports
| Question | Report |
|---|---|
| How many interactions resolved by AI or teammates, or closed by automations, have no recorded conversion? | Demand insights |
| Which conversations remain unresolved or failed SLA? | Service quality report |
| Which current conversations are waiting for the team? | Workload & capacity report |
| Which completed purchases and revenue were recorded? | Revenue report |
| How did conversations convert after they started? | Performance report |
Demand insights does not replace inventory reporting from the commerce platform or operational conversation reporting from Inbox.
Turn the report into an action
| If you see… | Review… |
|---|---|
| Unfulfilled increases | The period, closing states, recorded conversions, and a few representative interactions. |
| Lost revenue rises while Unfulfilled changes little | The average positive tracked revenue amount in the period; do not infer a change in the prices of products customers asked about. |
| Affected SKUs changes | The associated recommending Playbooks; this card does not identify SKUs or variants. |
| Unfulfilled rate rises while its count is stable | The total number of ended interactions used as the denominator. |
| A breakdown is empty | Whether that dimension has a calculation before interpreting the blank result as no activity. |
Verify the source records before changing a Playbook, recommendations, or inventory. An interaction without a conversion does not by itself explain what the customer needed.
When data is missing or unexpected
Confirm that:
- interactions have an end date within the selected period;
- their closing states and recorded conversions match what you expect to measure;
- there is positive tracked revenue in the period when interpreting Lost revenue; if there is none, the estimate uses the fixed fallback value;
- a recommending Playbook is associated if you expect a value under Affected SKUs;
- the interaction channel is recorded if you use that breakdown; and
- both comparisons use the same timezone, metric, and equivalent period.
Some interactions may have ended in the period while Unfulfilled still shows zero, because only certain closing states without a conversion enter that count. If the source records exist but the figures remain inconsistent, follow Data completeness and reporting gaps.
Related guides
Back-in-Stock Pounce and Smart Recommender address product scenarios separately; their results cannot be inferred from this report’s metrics.